Asst. Prof. Yu-Chiao Liang, Department of Atmospheric Sciences
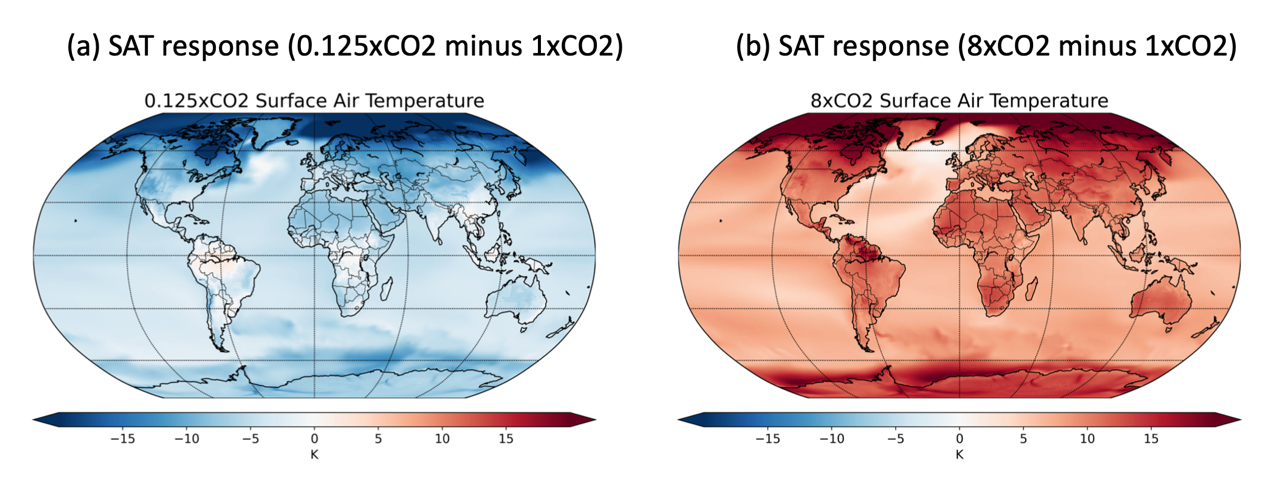
The Arctic is one of the clearest indicators of human-driven global warming, experiencing some of the fastest and most dramatic climate shifts in recent decades. In particular, the Arctic is warming about three to four times faster than the rest of the planet—a phenomenon climate scientists call Arctic amplification (see Figure 1b). To better understand what causes this amplified warming and how it affects the broader Earth system, the Polar Research Group at the Department of Atmospheric Sciences has been studying the key processes underlying the Arctic climate change.
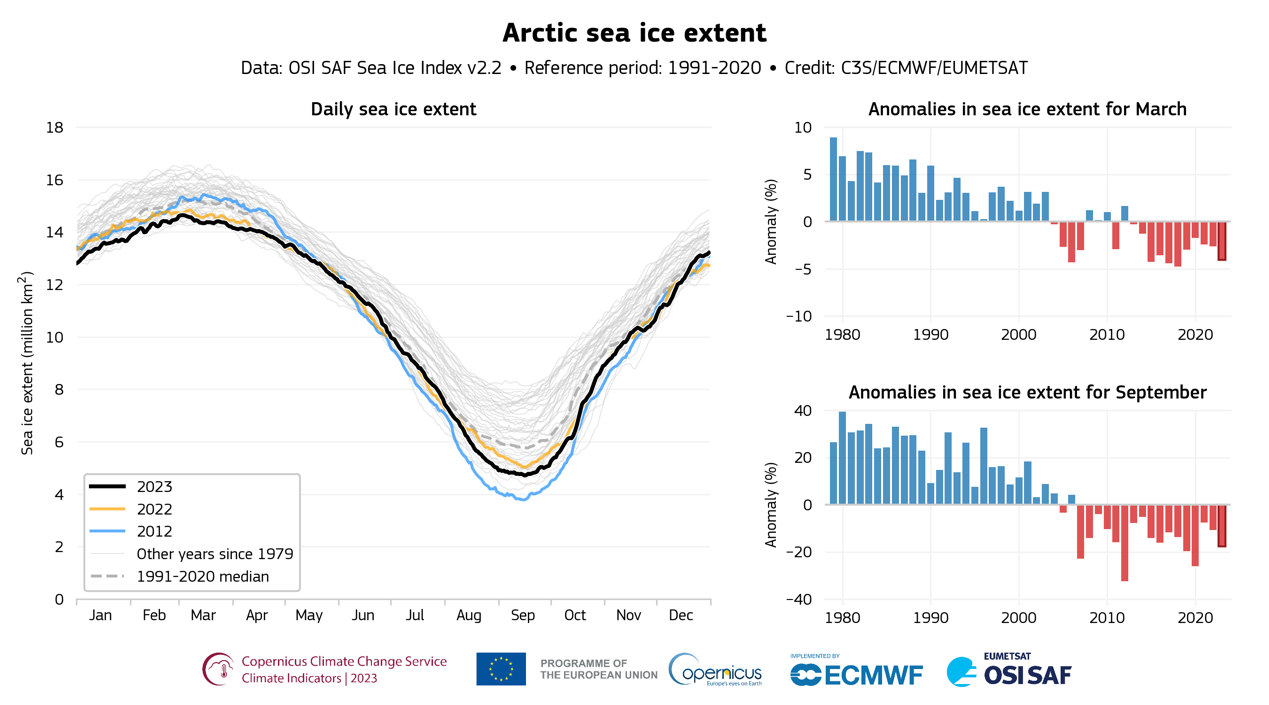
A major factor driving Arctic amplification is the sharp decline of sea ice (see Figure 2). As the ice melts, it reveals dark ocean water beneath, which efficiently soaks up much more sunlight during the warmer months compared to reflective ice surface. This extra heat is then released back into the atmosphere when the cold season returns, causing the region to warm even further. But the story does not end there. Our research shows that other factors are also important, including variations in temperature vertical profile throughout the Arctic atmosphere, feedback from clouds and water vapor, and the movement of heat through air and ocean currents coming from lower latitudes.
Interestingly, our findings reveal that Arctic amplification is not limited to global warming alone. The Arctic also reacts strongly during periods of global cooling, cooling even more than the worldwide average (Figure 1a). We call this Arctic amplification under cooling. Surprisingly, this cooling-driven effect may be even more intense than the warming-driven one. This means that natural cooling influences, like volcanic eruptions or human-made aerosols, could play a bigger role in shaping the Arctic climate than previously thought.
Our ongoing work not only deepens scientific understanding of the Arctic's rapidly changing climate but also highlights the complex ways both natural events and human activities influence this fragile region under the threat of global warming. These insights are essential for anticipating how Arctic ecosystems and industries might respond as global change continues to unfold.

Figure 1. Global temperature change in CO2 increasing (a) and decreasing (b) experiments. Credit: Shih-Ni Zhou.

Figure 2. Left panel: Daily Arctic sea-ice extent during the 1979–2023 period. The colors indicate the sea ice conditions in different years: 2012 (blue) orange (2022), and black (2023). The dashed gray line plots the median over the 1991–2020 reference period. Right panels: Monthly anomalies (%) in sea-ice extent during March (top) and September (bottom), calculated as the difference between the raw values and the monthly long-term 1001–2020 means. Credit: C3S/ECMWF/EUMETSAT and ECMWF.